Keywords
Hydrogen deflagration; premixed cloud; high-pressure jet; GASFLOW; Hydrogen refueling station
Purposes
• Validate the GASFLOW modelling using the H2 deflagration experiments of premixed cloud and high-pressure jet in full-scale refueling station.
• Investigate flame development and propagation, the high-pressure H2 release and dispersion with the effects of combustion models and turbulence models.
Descriptions
• Set-up the GASFLOW modelling according the experimental layout and B.C.. seeing the mesh and view of GASFLOW-MPI modelling in Fig. 1.
• Simulate the experiments of H2-air premixed cloud and high-pressure H2 jet, and compare the predictions and the experimental data (i.e. the overpressure evolution of each sensors), as seen in Figs. 2-4.
• Discuss the dynamics of flame propagation in H2-air premixed cloud with respect to various turbulent burning velocity models, as presented in Figs. 5-7.
• Discuss the release, dispersion and combustion of high-pressure H2 jet, as shown in Figs. 8-12.
Conclusions
• GASFLOW-MPI is validated well against the full-scale hydrogen refueling station deflagration experiments of H2-air premixed cloud and high-pressure H2 jet, with respect to the overpressures over time and the maximum overpressures over the distance across and along the vehicle.
• Turbulent burning velocity correlations are investigated in the explosion of the premixed H2–air cloud. The comparison shows Zimont correlation is recommended for the premixed combustion simulation of engineering full-scale H2 refueling station.
• Hydrogen dispersion transient computed with both k-ε and DES turbulence models can provide a reliable basis for estimating the combustion process. Overpressure comparison between real and ideal gas sources shows no significant difference.
• Momentum dominates the hydrogen dispersion during the jet H2 release, and a large zone with high turbulence forms after combustion. The growth and decay of the hydrogen dispersed indicates the flame could accelerate to sonic velocities or even a transition to detonation.
Reference
Fangnian Wang, Jianjun Xiao, Thomas Jordan, GASFLOW-MPI analysis on deflagration in full-scale hydrogen refueling station experiments: H2-air premixed cloud and high-pressure H2 jet, International Journal of Hydrogen Energy, Volume 47, Issue 32, 2022, Pages 14725-14739, ISSN 0360-3199, https://doi.org/10.1016/j.ijhydene.2022.02.215.
Fig. 1 Mesh (∆x=10 cm, x-y plane at elevation 0.5 m) and view of GASFLOW-MPI modelling.
Fig. 2 Overpressure evolution of each sensors in premixed trial.
Fig. 3 Maximum overpressure across and along the vehicle in premixed trial (note: horizontal distance means the sensors’ displacement across the vehicle from the vehicle center, while the vertical distance is the displacement along the vehicle from the vehicle center).
Fig. 4 Overpressure evolution of each sensor in jet .
Fig. 5 Overpressures in premixed trial with different turbulent burning velocity correlations: K4 under vehicle, K5 across vehicle, K10 along vehicle, KW13 on the wall.
Fig. 6 Temperature across the vehicle at various distances apart the ignition location (left), the estimated average flame speed across the vehicle (right)
Fig. 7 Pressure and temperature fields, and H2 volume fraction of the slice crossing the ignition position at the time of 30 ms, 60 ms, 90 ms after ignition.
Fig. 8 Development of hydrogen volume fraction (top subfigures) and velocity field (magnitude, bottom subfigures) of jet trial with the standard k-ε turbulence model, Zimont turbulence burning velocity correlation and ideal gas release injection: from the left to right column at 0.2 s, 0.5 s (H2 dispersion), 0.9 s (H2 combustion) respectively on the y-z slice of x=2.7 m the position of high-pressure H2 injection.
Fig. 9 History of average hydrogen volume fraction in room engine bay during the dispersion and combustion process (left), and development of hydrogen mass of the cloud above specific hydrogen concentrations in room engine bay (right).
Fig. 10 Shape and size of burnable H2 cloud at different time 0.1 s, 0.4 s, 0.7 s: top, standard k-ε model and bottom, DES model.
Fig. 11 Overpressure comparison with various turbulence models and release modes.
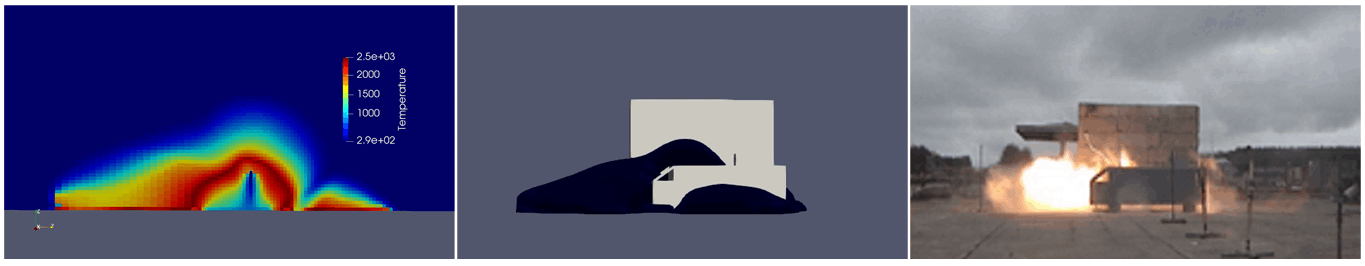
Fig. 12 Temperature distribution (vertical slice crossing the jet nozzle), contour (T = 1000 K) and the photo frame (Shirvill et al., 2012) after ignition ~ 80 ms.