Hydrogen Release and Dispersion Hydrogen Jet Fire Hydrogen Explosion
Hydrogen Release and Dispersion Hydrogen Jet Fire Hydrogen Explosion
Keywords
Tunnel accident, hydrogen release, fuel cell car, detonation, 3d simulation, overpressures
Purposes
• Simulation of a conservative tunnel accident scenario with hydrogen release from a fuel cell car, assuming three open temperature and pressure relieve devices (TPRDs).
• Calculation of turbulent mixing of hydrogen with air, prediction of space and time dependent hydrogen volume fractions in the tunnel.
• Hazard evaluation for the burnable hydrogen-air mixture with respect to possible combustion regimes in case of a weak ignition.
• Calculation of worst-case pressure loads from fastest possible combustion mode.
Descriptions
• The first step of the analysis consisted in the simulation of the sonic flow of hydrogen from the 70 MPa storage tank and the turbulent hydrogen mixing with air (Figs. 1 to 5).
• The second step was evaluation of the possible combustion modes of the generated hydrogen-air mixture using the criteria implemented in GASFLOW.
• As third step of the analysis, an ignition of the hydrogen-air cloud at the time of maximum reactivity was assumed. Since the criteria predicted the possibility of a detonation, GASFLOW was used to simulate a detonation in the tunnel. The mixture was ignited at the tunnel ceiling, where lamps are normally installed.
• Detonation pressure loads were predicted for the burnable cloud and the axially open boundary conditions in the tunnel.
Results
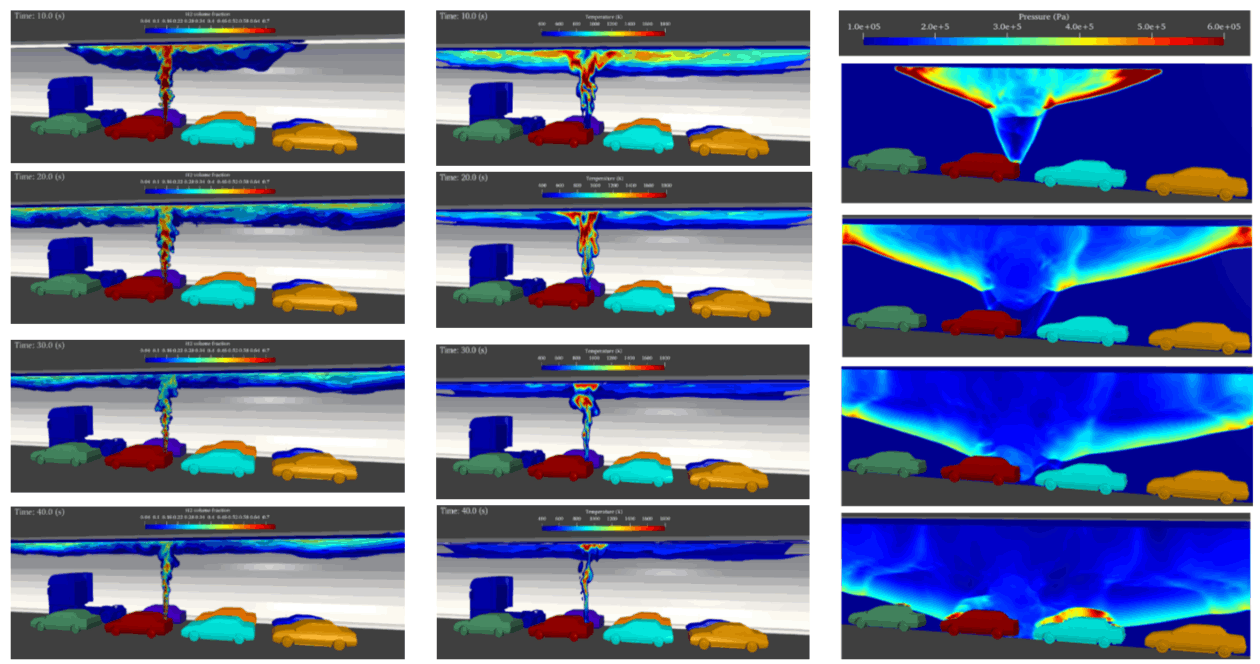
• The initial hydrogen release rate is about 0.5 kg/s. The maximum mass of burnable hydrogen amounts to 2.5 kg. This inventory is reached 16 s after begin of the release. Near-stoichiometric H2-air mixtures develop close to the ceiling (Figs. 3 and 4).
• The combination of adiabatic hydrogen expansion and turbulent mixing with ambient air leads to a wide temperature distribution in the burnable cloud (Fig. 5).
• The burnable cloud is highly reactive due to high hydrogen volume fractions and low temperatures, allowing a stable detonation in case of an ignition (D/7 λ > 1, Fig. 6).
• The non-reflected detonation pressure along the tunnel ceiling reaches up to about 0.7 MPa (Figs. 7 and 8). Reflected waves from cars can increase the peak pressures at the tunnel ceiling to 0.9 MPa. The blast wave speed in the reactive cloud is of the order of 1000 m/s, outside of the burnable cloud the wave speed is 600 to 800 m/s.
Conclusions
• Hydrogen release scenarios with TPRD failures and late ignition (here evaluated after 16 s) can lead to high overpressures in the tunnel.
• The effects of such overpressures on tunnel, cars and persons will be evaluated later.
• A less conservative scenario with early ignition of the hydrogen jet will be also analyzed. For such a case much lower overpressures, but higher thermal loads may be expected.
• A similar mechanistic and self-consistent risk analysis can be performed for other accident scenarios with different 3d geometries, gas release rates and total masses, ignition times and location, and various flame speeds.
Reference
Y. Li, J. Xiao, H. Zhang, W. Breitung, J. Travis, M. Kuznetsov, T. Jordan, Numerical analysis of hydrogen release, dispersion and combustion in a tunnel with fuel cell vehicles using all-speed CFD code GASFLOW-MPI, International Journal of Hydrogen Energy, Volume 46, Issue 23, 31 March 2021, Pages 12474-12486.
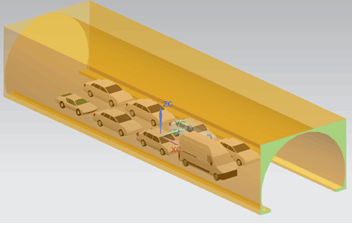
Fig. 1 Tunnel section with hydrogen release in vertical direction from a fuel cell car.
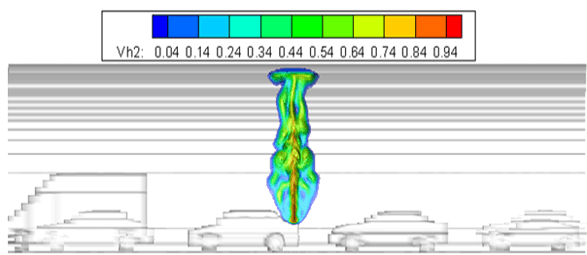
Fig. 2 Hydrogen volume fraction, longitudinal cut through burnable hydrogen cloud, 1 s after begin of the release. Shown is the hydrogen volume fraction in air for ≥ 4 % H2.
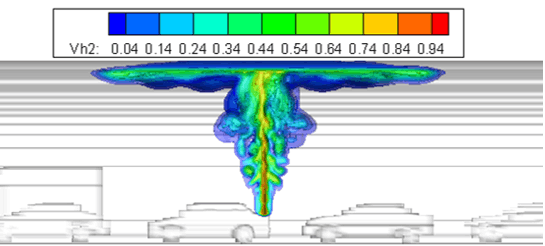
Fig. 3 Hydrogen volume fraction, longitudinal cut through burnable H2 cloud, 8 s after begin of the release. H2 volume fraction in air for ≥ 4 % H2.
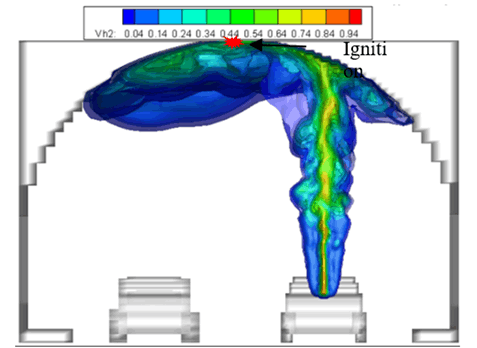
Fig. 4 Hydrogen volume fraction in cross section through burnable cloud, 16 s after begin of release (> 4% H2). At this time ignition is assumed at the tunnel ceiling.
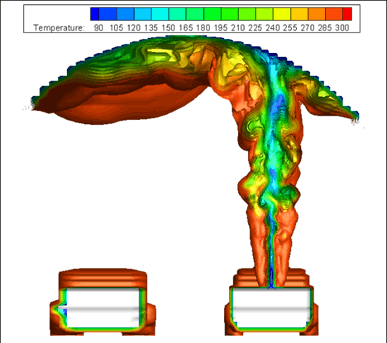
Fig. 5 Cross section through tempera-ture field of burnable cloud at the time of ignition (t=16 s). The gas temperature ranges from about 100 to 300 K due to adiabatic hydrogen expansion from 70 MPA and turbulent mixing with air.
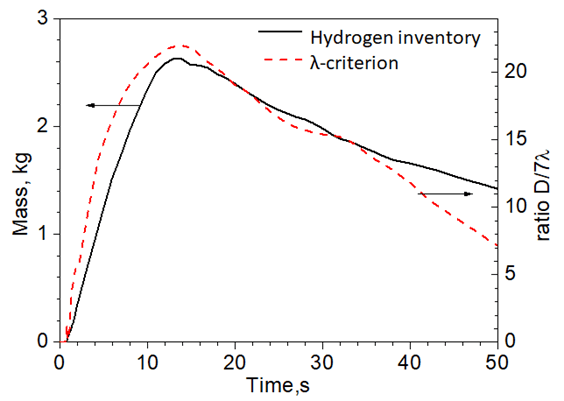
Fig. 6 Calculated hydrogen inventory of the burnable cloud in the tunnel and derived values for the λ-criterion. Detonations cannot be excluded if D/7λ > 1, D = characteristic size of burnable cloud = (cloud volume)1/3, λ = detonation cell size of average H2-air cloud mixture.
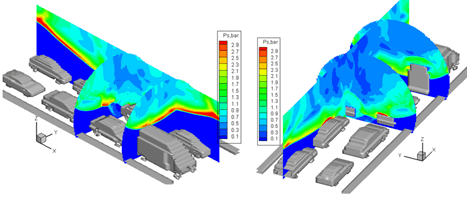
Fig. 7 3d pressure field in the tunnel after ignition of burnable cloud at the tunnel ceiling. Times are 7 ms (left) and 9 ms (right) after ignition, respectively.
Fig. 8 Calculated local pressure-time histories along the tunnel apex. x= distance from the release location in m.